Second enrichment of enriched Results

Enrichment of Enriched Results

The enriched result is too messy? Clean up it!

EnrichGT generates insightful results by simply constructing a term frequency matrix of genes enriched in pathways and performing clustering. While the results may not be statistically optimal, they offer significant interpretive insights.

Print ?egt_recluster_analysis for further help. But of note, you can adjust ClusterNum (Cluster the enrichment into N clusters) and nTop (Show how many top items in GT table) for a better result (the default is not all the best for your data).

Challenges in Biological Gene Enrichment Analysis

Gene enrichment analysis can often be misleading due to the redundancy within gene set databases and the limitations of most enrichment tools. Many tools, by default, only display a few top results and fail to filter out redundancy. This can result in both biological misinterpretation and valuable information being overlooked.

For instance, high expression of certain immune genes can cause many immune-related gene sets to appear overrepresented. However, a closer look often reveals that these gene sets are derived from the same group of genes, which might represent only a small fraction (less than 10%) of the differentially expressed genes (DEGs). What about the other 90%? Do they hold no biological significance?

Current Solutions

clusterProfiler is one of the most powerful tools in R for enrichment analysis. It’s designed with pathway redundancy in mind and includes the clusterProfiler::simplify function to address this issue. This method, based on GOSemSim for GO similarity evaluation, is scientifically robust and highly effective.

However, there are some drawbacks:

  • GOSemSim is not fast, particularly when dealing with large or complex gene sets.

  • It doesn’t support databases like KEGG or Reactome.

Using GOSemSim to measure the semantic similarity between pathways is, theoretically, the best way to tackle redundancy. However, in practical cases—especially in experimental bioinformatics validation—researchers are more focused on the genes behind these pathways rather than the pathways themselves.

Alternative Approaches

Although clustering pathways based on gene overlap has received some criticism, it remains a viable approach in many situations. For this reason, I developed BioThemeFinder a few years ago to solve this problem. However, the tool is so awful (I am poor in coding…)

Today, two excellent alternatives exist:

  • simplifyEnrichment: This package is more scientifically rigorous (based on semantic similarity) and creates beautiful visualizations. It also doesn’t support databases like KEGG or Reactome.
  • aPEAR: A simpler and faster tool that better aligns with practical needs, making it my preferred choice.

However, both of these tools have a common limitation: their visualizations are optimized for publication purposes rather than for exploratory research. I often find myself exporting CSV files or struggling with RStudio’s preview pane to fully explore enrichment tables. This inspired me to develop a more efficient solution. Also, they are slow.

Goals of This Package

The main purpose of developing this package is to provide a lightweight and practical solution to the problems mentioned above. Specifically, this package aims to:

Cluster enrichment results based on hit genes or core enrichment from GSEA using term frequency analysis (from the output of the powerful clusterProfiler). This provides a clearer view of biological relevance by focusing on the genes that matter most.

# From results generated before
res <- egt_enrichment_analysis(genes = DEGtable$Genes,
database = database_GO_BP(Org.Hs.eg.db))

re_enrich <- egt_recluster_analysis(
  res,
  ClusterNum = 10,
  P.adj = 0.05,
  force = F,
  nTop = 10,
  method = "ward.D2"
)

You can see the structure of re_enrich object above. The re_enrich object is an S4 EnrichGT_obj object. The first slot is the result table (a data.frame), and the second slot contains gt table.

str(re_enrich,max.level = 2)
Formal class 'EnrichGT_obj' [package "EnrichGT"] with 10 slots
  ..@ enriched_result     : tibble [67 × 7] (S3: tbl_df/tbl/data.frame)
  ..@ tinytable_obj       :Formal class 'tinytable' [package "tinytable"] with 33 slots
  ..@ gene_modules        :List of 10
  ..@ pathway_clusters    :List of 10
  ..@ document_term_matrix:Formal class 'dgCMatrix' [package "Matrix"] with 6 slots
  ..@ clustering_tree     :List of 7
  .. ..- attr(*, "class")= chr "hclust"
  ..@ raw_enriched_result : tibble [2,979 × 9] (S3: tbl_df/tbl/data.frame)
  ..@ fused               : logi FALSE
  ..@ param               :List of 6
  ..@ LLM_Annotation      :Formal class 'egt_llm' [package "EnrichGT"] with 2 slots

Access re-enriched data table

You can simple View(re_enrich@enriched_result) for the first slot.

re_enrich@enriched_result # Get the re-enrichment result table
# A tibble: 67 × 7
   Description                          ID    Count Cluster   PCT    Padj geneID
   <chr>                                <chr> <int> <chr>   <dbl>   <dbl> <chr> 
 1 synaptic transmission, glutamatergic GO:0…    19 Cluste…   4.2 8.10e-8 ATP1A…
 2 regulation of synaptic transmission… GO:0…    16 Cluste…   3.5 8.10e-8 ATP1A…
 3 modulation of chemical synaptic tra… GO:0…    39 Cluste…   8.5 8.10e-8 ACHE,…
 4 regulation of trans-synaptic signal… GO:0…    39 Cluste…   8.5 8.10e-8 ACHE,…
 5 synapse organization                 GO:0…    36 Cluste…   7.9 2.10e-6 ACHE,…
 6 regulation of neuronal synaptic pla… GO:0…    12 Cluste…   2.6 4.20e-6 APOE,…
 7 glutamate receptor signaling pathway GO:0…    11 Cluste…   2.4 5.20e-6 GRIA4…
 8 ionotropic glutamate receptor signa… GO:0…     8 Cluste…   1.8 1.10e-5 GRIA4…
 9 regulation of synaptic plasticity    GO:0…    20 Cluste…   4.4 4.50e-5 APOE,…
10 regulation of postsynaptic membrane… GO:0…    16 Cluste…   3.5 8.5 e-5 GABRD…
# ℹ 57 more rows

Access re-enriched HTML report

EnrichGT offers more than data frames. Please see HTML reports (tinytable table) for further visualization.

Glance details of each module

The re-enriched object from EnrichGT supports the $ subset operator. You can use it to glance details inside each cluster. In morden IDE like Positron, type $, and then press the Tab key for auto-completion, as shown in the figure.

But when you are still using RStudio (which auto-complete function is poor than ARK LSP), you can use names to get the cluster names.

names(re_enrich)
 [1] "Cluster_1"  "Cluster_10" "Cluster_2"  "Cluster_3"  "Cluster_4" 
 [6] "Cluster_5"  "Cluster_6"  "Cluster_7"  "Cluster_8"  "Cluster_9" 

In this example, all results haven’t got any extra annotation. But EnrichGT supports Large language models (LLMs) based enrichment result annotations, you can refer to large language models integration of EnrichGT page for more details. After performed LLM annotations, this step will display more information and insights about enrichment results. If you feel typing full names is bored, you can use c1 or C1 and even "1" to access it.

For example:

re_enrich$Cluster_1
── Enrichment Result of Cluster_1 (Local Summary) ──────────────────────────────
• This cluster contains synaptic transmission, glutamatergic, regulation of
synaptic transmission, glutamatergic, modulation of chemical synaptic
transmission, regulation of trans-synaptic signaling, synapse organization ...
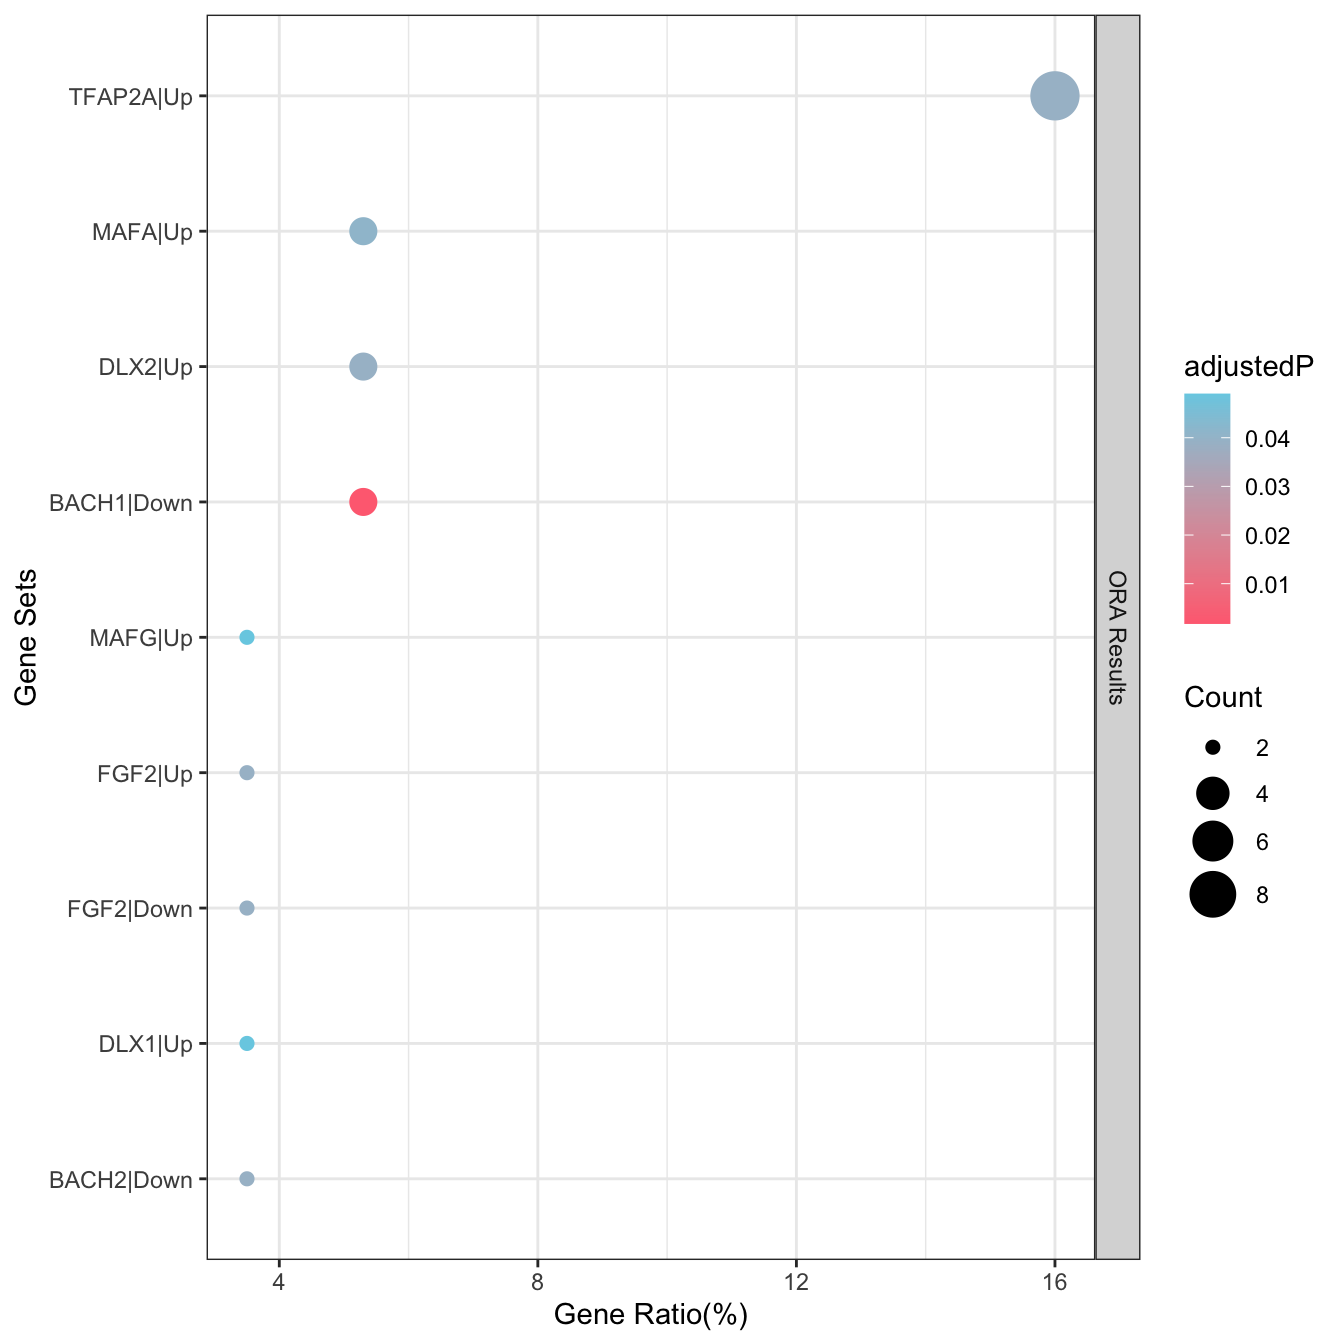
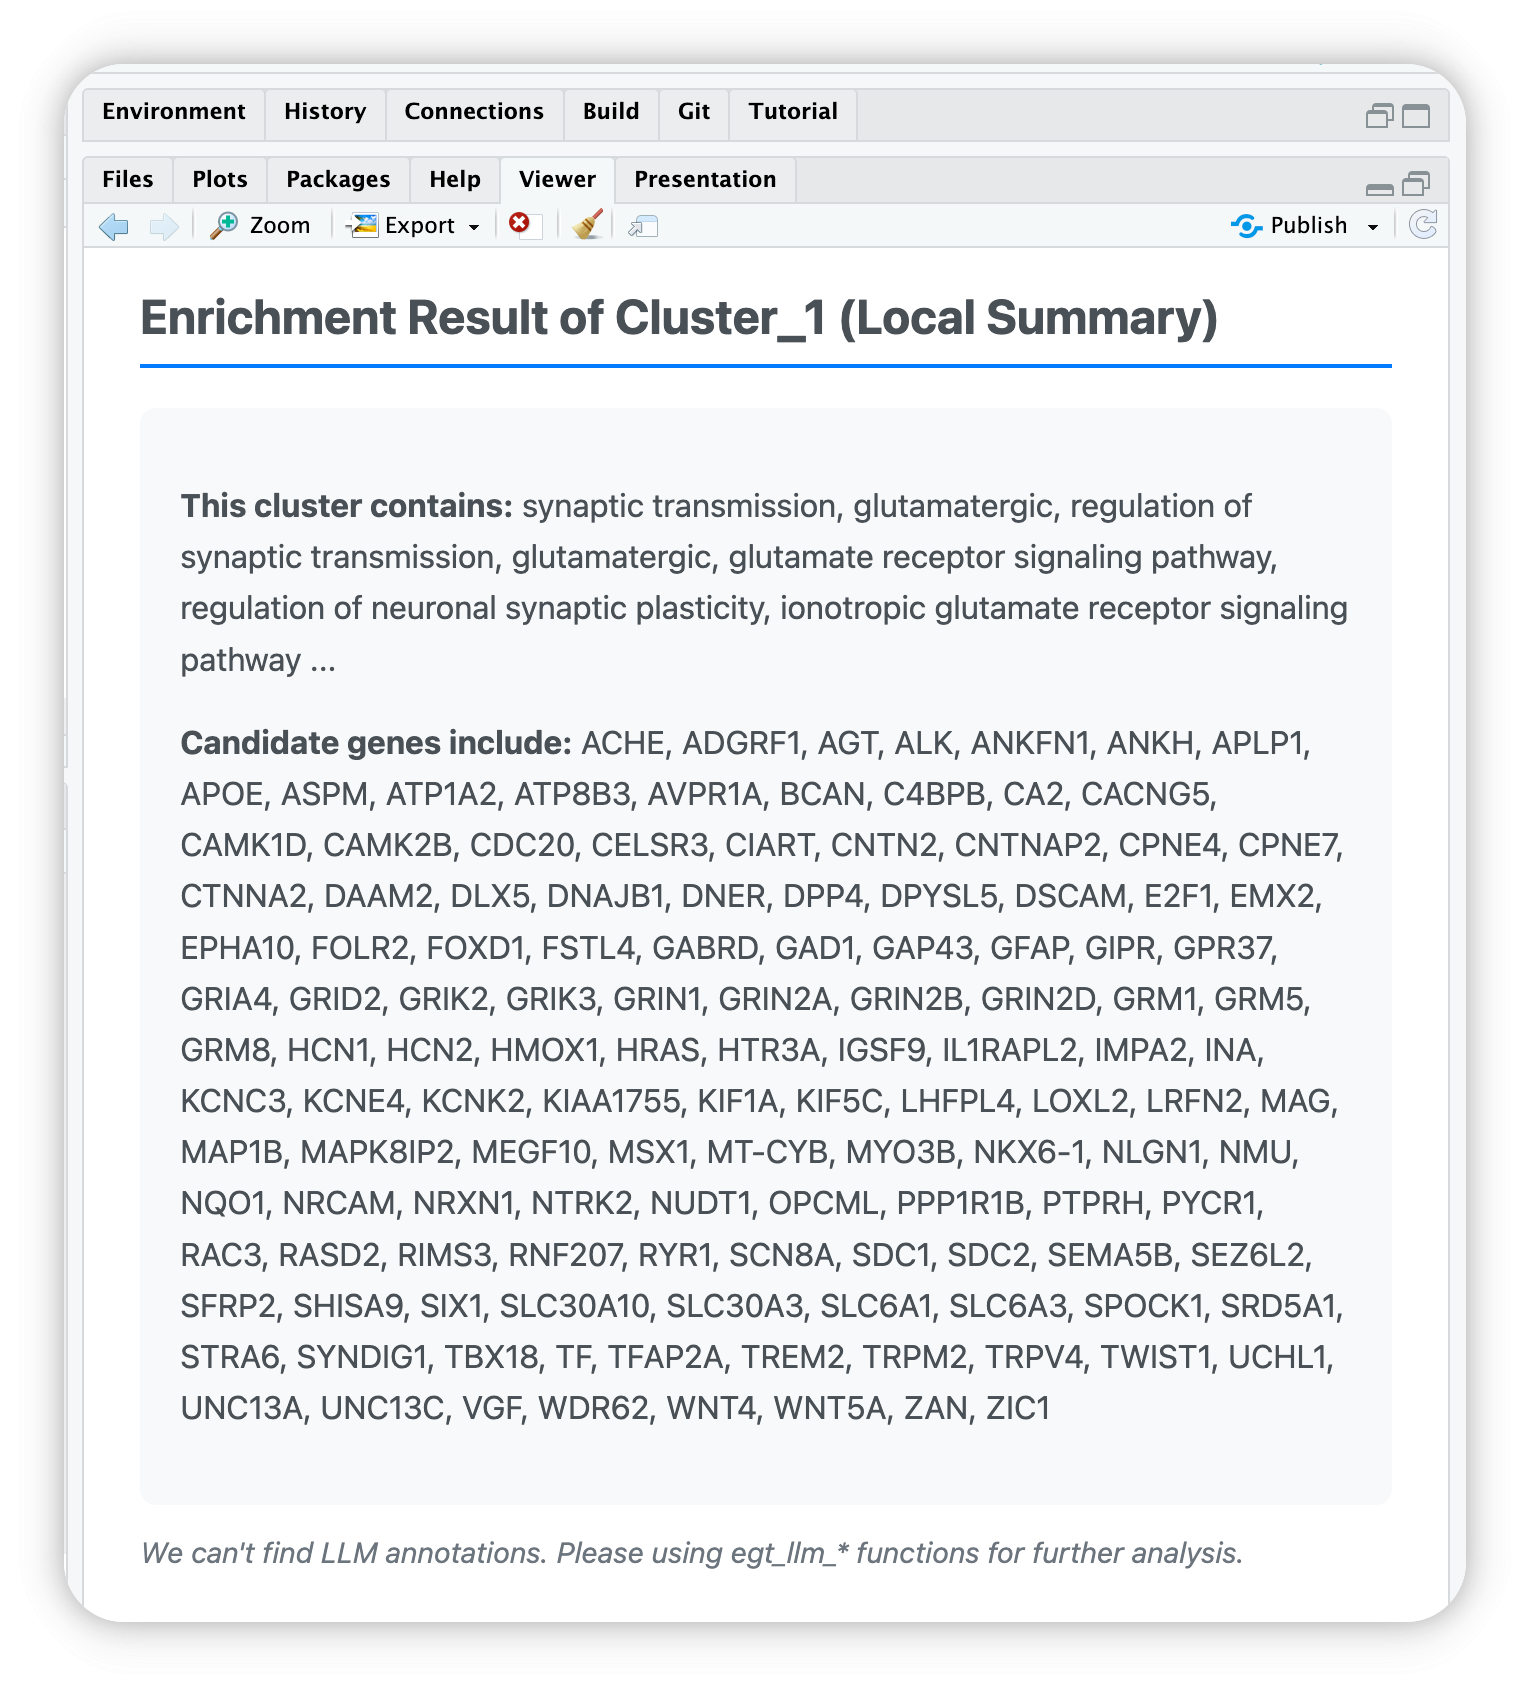
• Candidate genes includes ACHE, ADGRF1, APOE, ATP1A2, BCAN, CA2, CACNG5,
CAMK2B, CDC20, CDH6, CNTN2, CTNNA2, DGKI, DLGAP1, DNER, DSCAM, ERC2, GABRD,
GAP43, GFAP, GRIA4, GRID2, GRIK2, GRIK3, GRIN1, GRIN2A, GRIN2B, GRIN2D, GRM1,
GRM5, GRM8, HCN1, HRAS, HTR3A, IGSF9, IL1RAPL2, INA, KIF1A, LHFPL4, LRFN2,
MAP1B, MAPK8IP2, NLGN1, NMU, NRCAM, NRXN1, NTRK2, RAC3, RIMS3, SEZ6L2, SHISA9,
SIX1, SLC6A1, SYNDIG1, TREM2, UNC13A, UNC13C, VGF, WNT5A (We will print all
genes. Please stroll to top to read)
[1] "cli-92167-17"
re_enrich$c3
── Enrichment Result of Cluster_3 (Local Summary) ──────────────────────────────
• This cluster contains locomotory behavior, startle response, neuron
recognition, cell recognition, gas transport ...
• Candidate genes includes AKR1B1, ALK, ANKH, APLP1, APOE, ATP1A2, ATP8B3,
BCAN, C4BPB, CA2, CAMK2B, CDC20, CIART, CNTN2, CNTNAP2, COL1A1, CRYAB, CTNNA2,
DLX5, DPP4, DPYSL5, DSCAM, ENPP1, EPHA10, FOLR2, FOXD1, FOXS1, FSTL4, GAD1,
GAP43, GPR37, GPX1, GRID2, GRIN2A, GRIN2D, GRM1, GRM5, HBA1, HBA2, HBB, HCN1,
HCN2, HMOX1, IGSF9, KIAA1755, KIF5C, MAG, MAP1B, MB, MEGF10, NKX6-1, NLGN1,
NQO1, NRCAM, NRXN1, NTRK2, OPCML, PPP1R1B, RAC3, RASD2, RYR1, SDC1, SEMA5B,
SEZ6L2, SLC5A5, SLC6A1, SLC6A3, SOX8, SRD5A1, STAC2, STRA6, TDRD5, TFCP2L1,
TNNT1, TREM2, TRPM2, UCHL1, UNC13A, UNC13C, VGF, WNT5A, ZAN, ZIC1 (We will
print all genes. Please stroll to top to read)
[1] "cli-92167-22"
re_enrich$"5"
── Enrichment Result of Cluster_5 (Local Summary) ──────────────────────────────
• This cluster contains ear development, sensory organ morphogenesis, ear
morphogenesis, cochlea development, muscle tissue development ...
• Candidate genes includes AGT, ALPK2, BARX2, CELSR3, CENPF, COL11A1, CTHRC1,
DLX5, DNER, DSCAM, EYA2, FJX1, FOXC2, GPX1, GSDME, HCN1, HEY2, JAG1, KCNK2,
MEGF10, MSX1, MYLK2, MYO18B, MYO3B, NOX4, NTRK2, RYR1, SAPCD2, SDC1, SFRP2,
SGCZ, SIX1, SIX2, SOX8, STRA6, TBX15, TBX18, TFAP2A, TNNT1, TP73, TWIST1,
UCHL1, WFIKKN1, WNT4, WNT5A, ZIC1 (We will print all genes. Please stroll to
top to read)
[1] "cli-92167-27"

Further more, you can can use @ to get objects in S4. Like result@gene_modules returns genes in cluster.

How to get objects inside the S4 object?

You can use @, for example, x <- re_enrich@enriched_result returns a result table and x <- re_enrich@tinytable_obj returns a gt object.

Mask unnecessary results

In transcriptomic sequencing, we often encounter a particular scenario. For example, T cell-related pathways can still be enriched in certain tumors from NOD-SCID mice, which are thymus-deficient. However, such immune infiltration patterns should not be predominant in thymus-deficient mice. Why does this happen? It’s likely due to shared immune response processes—such as interleukin and cytokine-related biological events—that are common across various immune cell types. What you’re seeing might be the surface reflection of a complex and chaotic underlying process.

Clearly, neither ORA nor GSEA is capable of correcting for such biases—let alone account for rare cell types or unique tissue microenvironments. In such cases, filtering out certain pathways isn’t falsification; it’s a way to minimize potential misunderstandings for readers or collaborators.

That said, I must emphasize: although this is a useful feature, please don’t use it to blindly dismiss pathways—existence implies relevance. It’s an art of trade-off. Nevertheless, every pathway with an FDR less than 0.05 deserves careful consideration.

In EnrichGT, you can simply use %-delete->% operator to achieve this:

# Filter out "ribosome" related terms in re-enriched object
filtered_results <- reenrichment_obj %-delete->% "ribosome"

# Filter data.frame directly from ORA/GSEA result is also OK
filtered_df <- df %-delete->% "metabolism"

It uses regular expression to help you remove them. Regular expression have many high-level ways to use, you can ask for Google for more details.

Infering TFs or pathway activity and more based on meta-gene modules

Based on re-enriched result, the S4 object return from re-enrichment contains gene_modules slot and pathway_clusters slot. In gene_modules slot you can find a group of meta-genes take part in specific pathway cluster (in pathway_clusters slot).

EnrichGT supports inferring Pathway or Transcript Factors activity from re-enriched meta-gene modules. This is accomplished by two amazing database:

  • PROGENy is a comprehensive resource containing a curated collection of pathways and their target genes, with weights for each interaction.

  • CollecTRI is a comprehensive resource containing a curated collection of TFs and their transcriptional targets compiled from 12 different resources. This collection provides an increased coverage of transcription factors and a superior performance in identifying perturbed TFs compared to our previous.

Now let’s see this example:

re_enrich_smaller_clusterNum <- 
  egt_recluster_analysis(
  ora_result,
  ClusterNum = 6, # reduce the cluster nums. 
  P.adj = 0.05,
  force = F,
  nTop = 10,
  method = "ward.D2"
)
✔ re-enrichment done.
ℹ You can adjust the param of egt_recluster_analysis() for better results. Please refer to the help page. 
TF_Act <- egt_infer_act(re_enrich_smaller_clusterNum,DB = "collectri", species = "human")
! If when doing re-enrichment, you select a high number of clusters, that may cause low gene number in each meta-gene module, and then can't be infered sucessfully. So if result is empty, please increase the number of re-clustering when doing it. 
✔ success loaded self-contained database
✔ Done ORA in 0.0181510448455811 sec.
✔ Done ORA in 0.0142009258270264 sec.
✔ Done ORA in 0.0143129825592041 sec.
✔ Done ORA in 0.0139079093933105 sec.
✔ Done ORA in 0.014354944229126 sec.
✔ Done ORA in 0.0136799812316895 sec.
egt_plot_results(TF_Act$Cluster_3)
ℹ Use Default P-adjust cut-off 0.05. You can pass `P.adj=xxx` arugument to filter. 
! You are drawing origin results, for better result you can re-cluster it by egt_recluster_analysis()

Wants to interpret the regulator of whole inputted genes?

PROGENy and CollecTRI can be used just like other database in ORA or GSEA enrichment, for example, the database_GO_BP(). See [Progeny Database] and [CollecTRI Database] page for detail.

Example:

TFActivity <- egt_enrichment_analysis(genes = DEGtable$Genes,
database = database_CollecTRI_human())
Why many inferred results are empty?

If when doing re-enrichment with a high number of clusters, that may cause low gene number in each meta-gene module (splitting into too many clusters make gene in each cluster is not enough to enrich), and then can’t be inferred successfully. So if result is empty, please increase the number of re-clustering when doing it.

Back to top